Are the boats even?
Rotation sheets, a null that keeps the rotation, and a chain of tests: boats differ by about 0.3 places a race, a good sailor doesn't leave a boat faster, fleets are uneven from day one, and a boat term in the rating model predicts 0.12 places a race between a fleet's best and worst fifth on held-out regattas.
Yes, some boats in a fleet are slow — but less than sailors think, a good sailor doesn't leave a boat faster for the next crew, and a fleet's unevenness is a property it arrives with, not one it wears into. Here is the chain of tests, in order, with the trap at each step.
1. The data, and the trap in it
Techscore's rotation sheets say which sail number each team had in each race: 964,000 team-races across 3,800 regattas, matched to 97% of our scored ICSA boat-races. Each team's result is converted to a surprisal — how much better or worse it finished than its pre-regatta rating predicted, in standard-error units — and demeaned within the team's regatta, so the team's form that weekend is gone. What remains is race-to-race movement; a boat's effect is its average over everyone who sailed it.
The trap: teams keep a boat for two races, then it passes to another team. A naive test treats those two races as independent evidence about the boat, when they are mostly evidence about the team in it. So the null hypothesis has to keep that structure: within each rotation set the sail numbers are relabelled at random, consistently for every team, and the boat-effect variance is recomputed. Only variance beyond that is boat.
2. Two artefacts to clear before believing anything
Same team, same boat again. The raw correlation between a team's two stints in the same boat is −0.16 — which looks like "a boat that went well goes badly next time". It is arithmetic: demeaning a team's k stints forces them to sum to zero, so any two correlate about −1/(k−1). The same team's stints in different boats correlate −0.18. Same boat is 0.02 less negative: the small boat signal again, nothing more.
Does a good sailor tune the boat for the next crew? 211,396 handovers where a different team takes the boat in the next set:
Does inheriting a strong team's boat help?
The same question from the other side: for 211,390 handovers starting at race 3 or later, the next team's surprisal against the previous occupant's rating relative to the fleet.
One sub-slice, the second rotation set, reads +0.009 ± 0.004 per point; it is one of five set-level slopes (set 4 is −0.007 the other way), splits into +0.017 and +0.001 on random halves of the regattas, and would be worth four hundredths of a place a race even if real. Not news.
Is there a team whose boat you want next? Per previous-occupant school (109 with 300+ handovers): the spread of school effects is narrower than chance (sd of z 0.68 against 1.00), none beyond two sigma (5 expected), and the school means do not replicate between halves of the data (r = -0.34). Per skipper (524 with 100+): sd 0.89, 19 beyond two sigma against 24 expected. Nobody rigs a boat for the next crew, and nobody wrecks one.
3. Does a boat carry its effect to the next regatta?
A boat here is a sail number at one host, in one class, in one season (A and B divisions share a fleet unless the class is listed as "420/FJ"). Correlate a sail's effect in one regatta with the same sail at the same host later:
So pooling helps, out to a horizon. Out of sample, predicting a regatta's boat effects from all earlier regattas at the host is best with a decay of 0.75–0.85 per half-season on older evidence (r ≈ 0.065); never decaying is worse than same-season-only, because three-year-old evidence describes a different boat.
4. Fleets, season by season


5. Finding the fleet changes
Within an era each sail has a constant effect; a boundary is placed where splitting the seasons reduces the weighted squared error by more than a penalty, and the penalty is calibrated per fleet by shuffling the season order until shuffled orders produce no boundary 95% of the time. Where that is too strict, the weakest link in the chain of pooled season-to-season correlations does the same job with less certainty. Scorers' daily summaries ("brand new Zim FJs", "first regatta in the new Larks") give the answer key:
| Fleet | Scorer / owner says | The data said |
|---|---|---|
| BU FJ | f12 | f12 |
| Tufts Lark | s16 | f16 |
| Cornell 420 | s15 | f15 |
| Eckerd FJ | s15 | f14 |
| MIT FJ | f14 | f13 |
| Wisconsin 420E | f17 | s16 |
| Brown FJ | f17 | 2012–18 gap |
| Brown FJ | winter 2023–24 | f23 | s24 (weakest link) |

6. Uneven fleets and even ones
Within an era, each sail's pooled effect divided by its standard error is a z-score. An even fleet gives a standard normal; an uneven one gives a wider distribution.

| Fleet, era | Sails | sd of z (1 = even) | Boats beyond 2σ | Fleet χ² p |
|---|---|---|---|---|
| Cornell 420 f15-f17 | 18 | 2.15 | 6 | < 0.001 |
| Tufts lark f16-f18 | 21 | 2.11 | 6 | < 0.001 |
| Kings Point 420 f21-f23 | 19 | 2.00 | 8 | < 0.001 |
| Harvard fj s19-s24 | 18 | 1.15 | 1 | 0.21 |
| Navy fj/z420 s19-f22 | 18 | 0.88 | 0 | 0.77 |
| Brown fj s24-f25 | 18 | 1.18 | 2 | 0.17 |
Six to eight boats per uneven fleet are individually beyond two sigma; in the even fleets one is, which is what 18 draws give by chance.
7. Wear: by class, by age
Model each sail's true effect as a random walk with variance q per half-season, estimated from how the squared difference between two seasons' effects grows with the gap between them, within eras:
| Class | Fleets | Drift q (z² / half-season) | Half-life of the fast/slow ranking | Unevenness τ (z) | τ in places / race |
|---|---|---|---|---|---|
| FJ | 44 | 0.0032 ± 0.0003 | 1.3 yrs | 0.108 ± 0.007 | 0.25 |
| 420 | 39 | 0.0002 ± 0.0004 | 12.7 yrs | 0.095 ± 0.006 | 0.22 |
| Z420 | 7 | 0.0023 ± 0.0007 | 1.3 yrs | 0.093 ± 0.022 | 0.21 |
FJ fleets reshuffle faster than 420 fleets — but hold the ratio loosely. Both drifts are small next to the measurement noise (season-to-season changes, scaled by their noise, have variance 1.10 for FJs and 1.03 for 420s against 1.00 for no change at all), and a half-life is τ² divided by that small number, so "1.3 years vs 13" is really "a year or two vs several". The changes show no jump signature either (excess kurtosis ≈ 0, large moves at the Gaussian rate, drops and gains equally common): single-boat events of the size that matters, a tenth of a place a race, are below what four regattas a season can resolve, so a physically sensible damage-and-repair model (boats only degrade; repairs and others' damage are what make a boat faster relative to the fleet) is indistinguishable here from a small symmetric walk. How uneven a fleet is does not depend on class — and it does not depend on age either:

8. The prior, applied
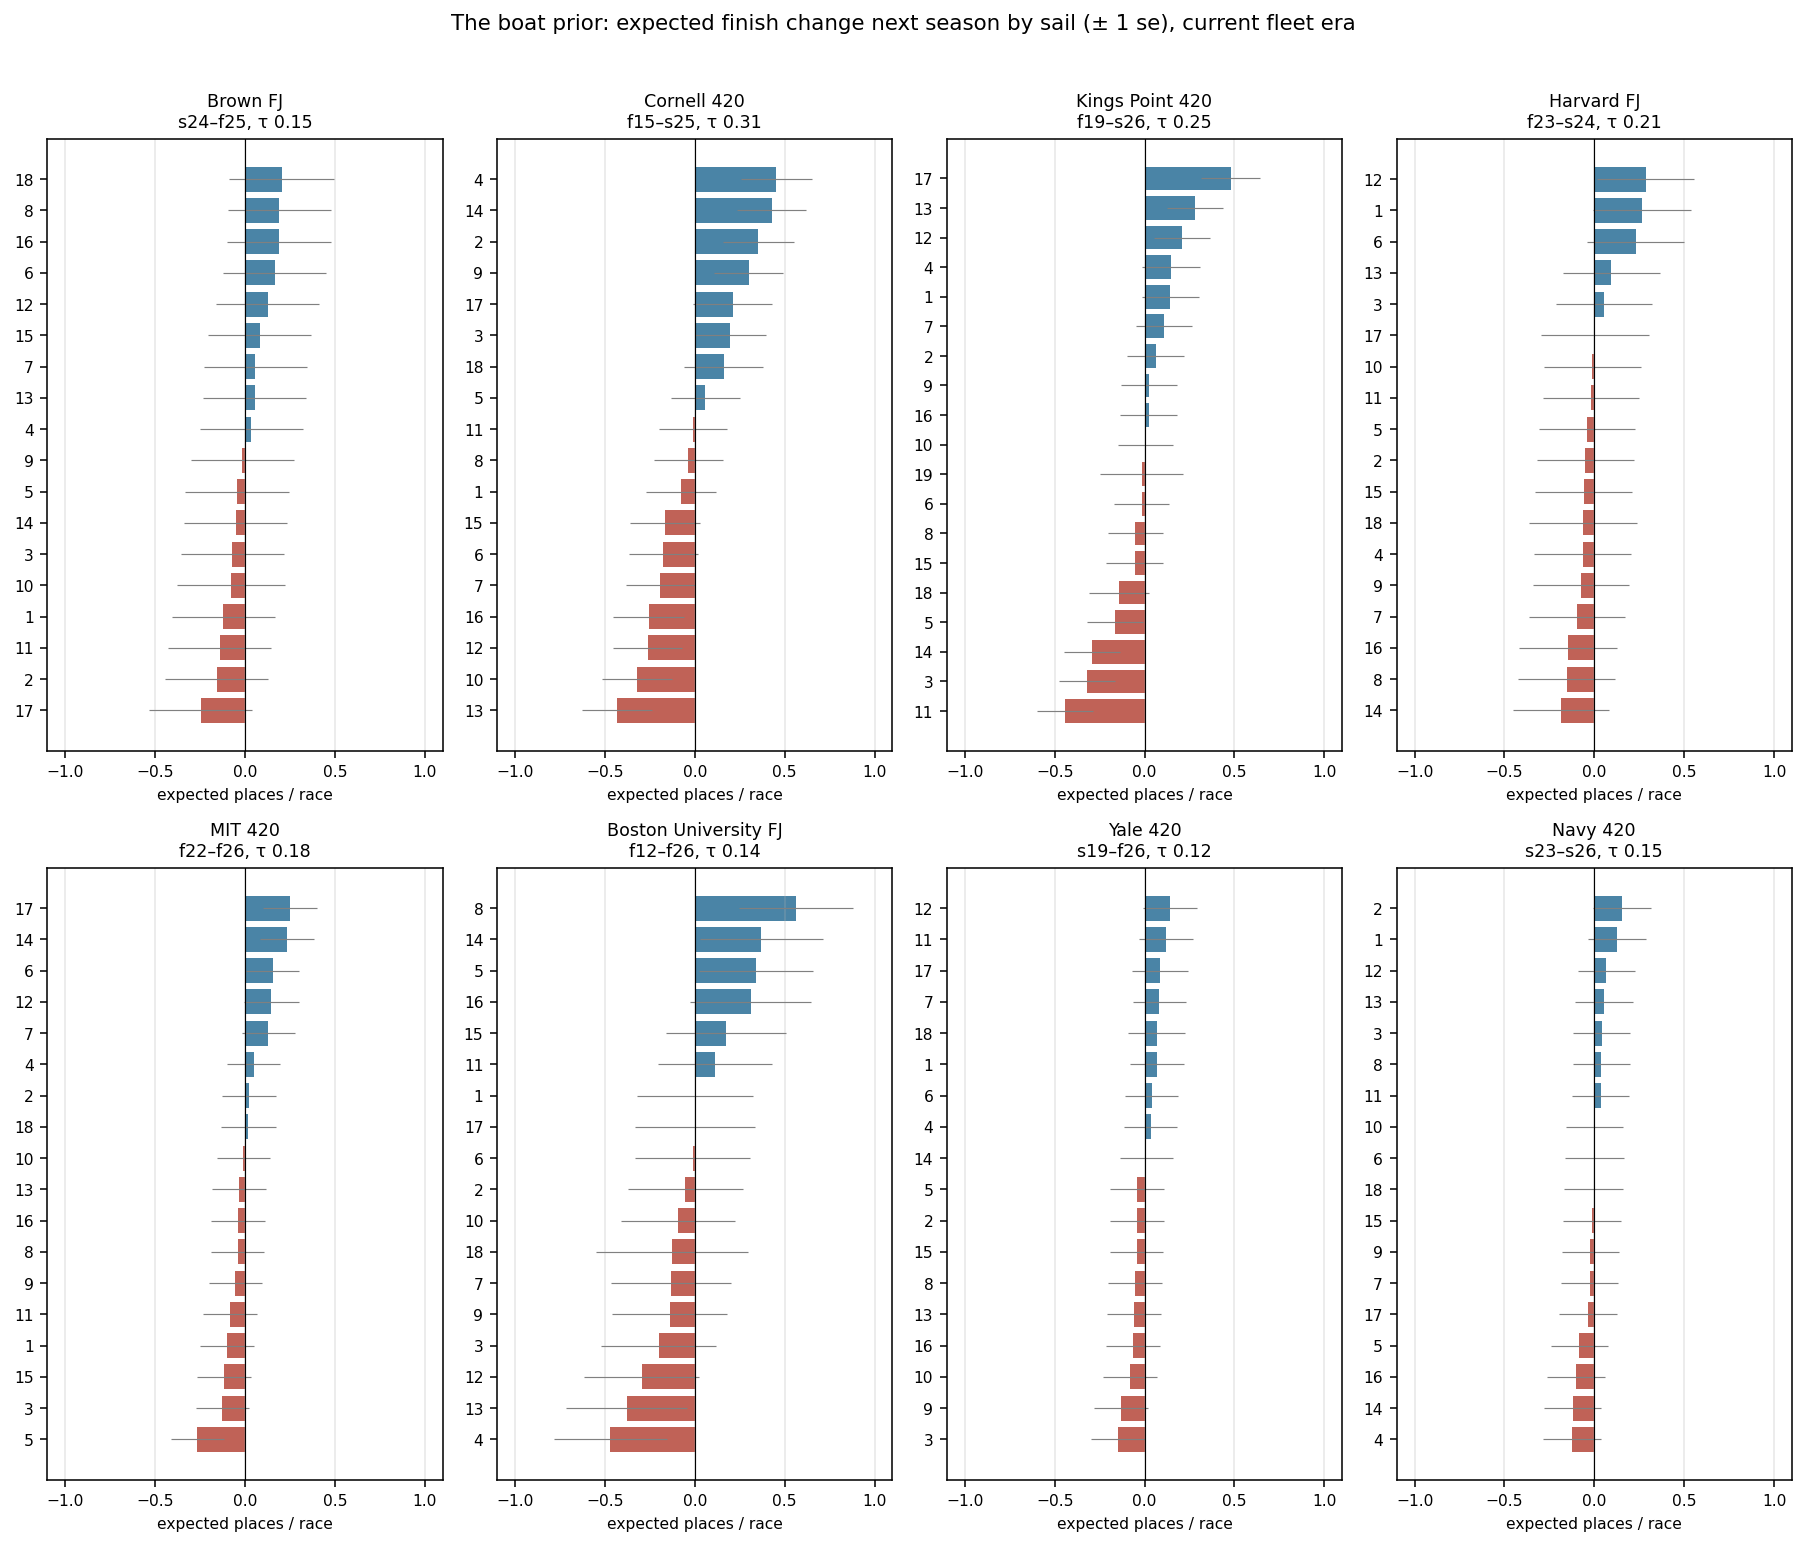
Put together: the fleet's current era (a scorer-dated purchase, else a multi-year gap in hosting, else all its data), its own unevenness τ as the prior spread, the class drift q as the random walk, and a Kalman pass over the era's seasons. Each sail gets an expected finish change for next season with an uncertainty.
| Fleet | Era | Era from | τ (places/race) | Best sail | Worst sail | Spread, places/race / pts per 16 |
|---|---|---|---|---|---|---|
| Brown FJ | s24–f25 | confirmed | 0.15 | 18 (+0.21) | 17 (-0.26) | 0.47 / 7 |
| Cornell 420 | f15–s25 | gap/first data | 0.31 | 4 (+0.45) | 13 (-0.43) | 0.88 / 14 |
| Kings Point 420 | f19–s26 | gap/first data | 0.25 | 17 (+0.48) | 11 (-0.44) | 0.92 / 15 |
| Harvard FJ | f23–s24 | gap/first data | 0.21 | 12 (+0.28) | 14 (-0.18) | 0.47 / 7 |
| MIT 420 | f22–f26 | confirmed | 0.18 | 17 (+0.25) | 5 (-0.27) | 0.52 / 8 |
| Boston University FJ | f12–f26 | confirmed | 0.14 | 8 (+0.57) | 4 (-0.47) | 1.04 / 17 |
| Yale 420 | s19–f26 | gap/first data | 0.12 | 12 (+0.15) | 3 (-0.15) | 0.30 / 5 |
| Navy 420 | s23–s26 | gap/first data | 0.15 | 2 (+0.15) | 4 (-0.12) | 0.27 / 4 |
Tufts' new FJs have too few regattas yet for any prior. The Boston University row runs the full 2012–26 era with FJ drift, so its older seasons contribute almost nothing; a confirmed later purchase would shorten it.
9. Predicting boat quality, tested on held-out regattas
The averaging above treats a boat's effect as a residual. The cleaner way is to put the boat inside the rating model itself: in the Plackett–Luce likelihood each team's strength in a race is its skipper's and crew's rating that week, plus a team-at-regatta term for form, plus a term for the boat it is in. The boat terms of a fleet-era are shrunk toward zero with the era's own unevenness τ, which is estimated at the same time, and everything is fitted jointly on the GPU (63,093 races, 8,268 boats in 500 fleet-eras). Then the honest test: hold out every third regatta in every fleet (1,103 regattas, 20,494 races), fit on the rest, and ask what the boat term knows about the regattas it has never seen.
The fitted term is over-confident on its own: used at full size it makes the held-out finishing orders slightly less likely than the ratings alone. Scaled down it helps, and the best scale says how much of a boat's fitted effect is a property of the boat that travels to the next regatta:
So the prediction method is: fit the boat term on the fleet's current era, and expect 0.4 of it in the next regatta. At that scale the prediction is nearly calibrated (realised effects run 0.85 of predicted), and the boats it rates in the top fifth of a fleet beat the boats it rates in the bottom fifth by +0.12 ± 0.02 places a race in regattas it has not seen — about 2 points over a 16-race regatta. That is the reproducible edge in knowing the boats: the size of a good crew swap, three to four times larger in the uneven 420 fleets at Cornell and Kings Point, and essentially nil in Brown's or Yale's.
Why 0.4, and why not more? Within a single fleet-season the true spread of boats is τ = 0.105 z for FJs and 0.089 for 420s (about 0.24 places a race), against a per-regatta measurement noise of 0.37 z, so a sail's effect in one regatta is mostly noise and the term that fits it has to be discounted. Pooling the era is what makes the 40% recoverable:
What it is worth
- A one-sd boat is 0.3 places a race; in an uneven fleet the worst boat costs about a place a race, 15–20 points over a regatta. In Harvard's, Navy's or Brown's current fleets the boat you draw is worth under a quarter of a place.
- The boat can be predicted: fit it as a term in the rating model on the fleet's current era (confirmed purchase, detected break, or a multi-year gap in hosting) and take 0.4 of it. On regattas the fit never saw, the predicted-best fifth of a fleet beats the predicted-worst fifth by 0.12 places a race, 2 points over a regatta.
- Nothing here says a well-sailed boat is handed over fast, that any team's or skipper's boat is worth inheriting, or that a rotation can be gamed beyond knowing which sail is the slow one this season.
Every number on this page is produced by analysis/blog/boat_effects.py, boat_inherit.py, boat_fleet_prior.py, boat_pl.py, boat_pl_wind.py, boat_season_signal.py, boat_decay_shape.py, boat_season.py, boat_carry.py, boat_changepoints.py, boat_wear*.py, boat_post_data.py in the project repository, from the same database that powers the rest of the site. Corrections welcome: quinnbrighton2005@gmail.com.